
Coupa Investor Presentation

INTRO FINANCIAL APPENDIX HIGHLIGHTS
SAFE HARBOR STATEMENT This presentation and the accompanying oral presentation include forward-looking statements. We intend for such forward‐looking statements to be covered by the safe harbor provisions for forward‐looking statements contained in the U.S. Private Securities Litigation Reform Act of 1995. All statements other than statements of historical facts, including statements regarding our future results of operations and financial position, customer lifetime value, strategy and plans, market size and opportunity, competitive position, industry environment, potential growth opportunities, business model, benefits from acquisitions, products and product capabilities and our expectations for future operations, are forward-looking statements. Forward‐looking statements can be identified by terms such as “anticipate”, “believe”, “estimates”, “targets”, “projects”, “could”, “ expect”, “seeks”, “intend”, “may,” “plan”, “predict”, “potential”, “prospects”, “should”, “will”, “would” or similar expressions and the negatives of those terms, although not all forward‐looking statements contain these identifying words. We have based these forward- looking statements on our current expectations and projections about future events and trends that we believe may affect our financial condition, results of operations, strategy, short- and long-term business operations and objectives, and financial needs. These forward-looking statements are subject to a number of risks, uncertainties and assumptions, including those described in “Risk Factors” in our most recently filed Form 10-K or 10-Q, which is available at www.investors.coupa.com and on the SEC’s website at www.sec.gov. We operate in a very competitive and rapidly changing environment. New risks emerge from time to time. It is not possible for our management to predict all risks, nor can we assess the impact of all factors on our business or the extent to which any factor, or combination of factors, may cause actual results to differ materially from those contained in any forward-looking statements we may make. In light of these risks, uncertainties and assumptions, the forward-looking events and circumstances discussed in this presentation may not occur and actual results could differ materially and adversely from those anticipated or implied in the forward-looking statements. You should not rely upon forward-looking statements as predictions of future events. Although we believe that the expectations reflected in the forward-looking statements are reasonable, we cannot guarantee that the future results, levels of activity, performance or events and circumstances reflected in the forward-looking statements will be achieved or occur. Moreover, except as required by law, neither we nor any other person assumes responsibility for the accuracy and completeness of the forward-looking statements. Forward-looking statements represent our management’s beliefs and assumptions only as of the date of this presentation. We undertake no obligation to update publicly any forward-looking statements for any reason after the date of this presentation to conform these statements to actual results or to changes in our expectations. In addition to U.S. GAAP financials, this presentation includes certain non-GAAP financial measures. These non-GAAP measures are in addition to, not a substitute for or superior to, measures of financial performance prepared in accordance with U.S. GAAP. A reconciliation of historical non-GAAP measures to historical GAAP measures is contained in the Appendix. Coupa is not able, at this time, to provide a GAAP to non-GAAP reconciliation for certain business model measures because of the difficulty of estimating certain items excluded from these non-GAAP measures that cannot be reasonably predicted, such as charges related to stock-based compensation expense. The effect of these excluded items may be significant. ©2017 Coupa Software, Inc. – Confidential – All Rights Reserved 2
ROB BERNSHTEYN CHIEF EXECUTIVE OFFICER ©©22001177 C Coouuppaa SSooffttwawarree,, IInncc.. –– CCoonnffiiddeennttiiaall –– AAllll Ri Rigghhttss ReResseervrveded 3 3
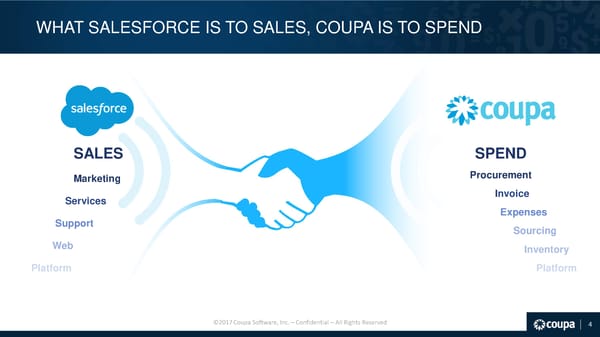
WHAT SALESFORCE IS TO SALES, COUPA IS TO SPEND SALES SPEND Marketing Procurement Services Invoice Expenses Support Sourcing Web Inventory Platform Platform ©2017 Coupa Software, Inc. – Confidential – All Rights Reserved 4
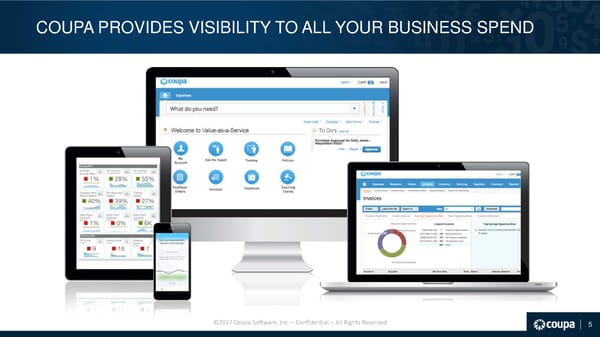
COUPA PROVIDES VISIBILITY TO ALL YOUR BUSINESS SPEND ©2017 Coupa Software, Inc. – Confidential – All Rights Reserved 5
BREADTH OF CUSTOMERS ©2017 Coupa Software, Inc. – Confidential – All Rights Reserved 6
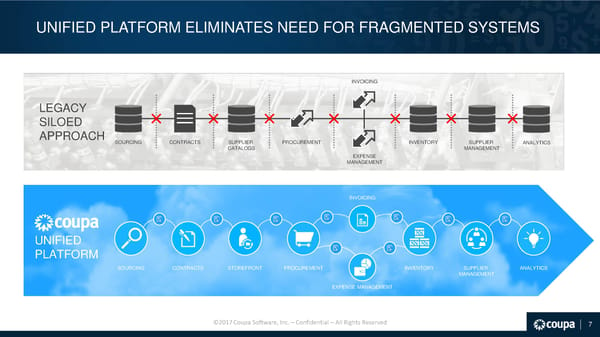
UNIFIED PLATFORM ELIMINATES NEED FOR FRAGMENTED SYSTEMS INVOICING LEGACY SILOED h APPROACH SOURCING CONTRACTS SUPPLIER PROCUREMENT INVENTORY SUPPLIER ANALYTICS CATALOGS MANAGEMENT EXPENSE MANAGEMENT INVOICING UNIFIED PLATFORM SOURCING CONTRACTS STOREFRONT PROCUREMENT INVENTORY SUPPLIER ANALYTICS MANAGEMENT EXPENSE MANAGEMENT ©2017 Coupa Software, Inc. – Confidential – All Rights Reserved 7
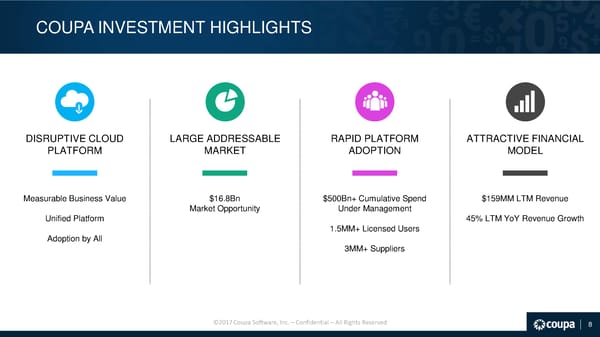
COUPA INVESTMENT HIGHLIGHTS DISRUPTIVE CLOUD LARGE ADDRESSABLE RAPID PLATFORM ATTRACTIVE FINANCIAL PLATFORM MARKET ADOPTION MODEL Measurable Business Value $16.8Bn $500Bn+ Cumulative Spend $159MM LTM Revenue Market Opportunity Under Management Unified Platform 45% LTM YoY Revenue Growth 1.5MM+ Licensed Users Adoption by All 3MM+ Suppliers ©2017 Coupa Software, Inc. – Confidential – All Rights Reserved 8
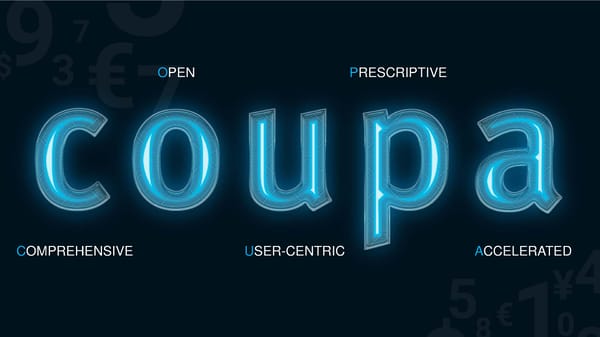
OPEN PRESCRIPTIVE COMPREHENSIVE USER-CENTRIC ACCELERATED ©2017 Coupa Software, Inc. – Confidential – All Rights Reserved 9
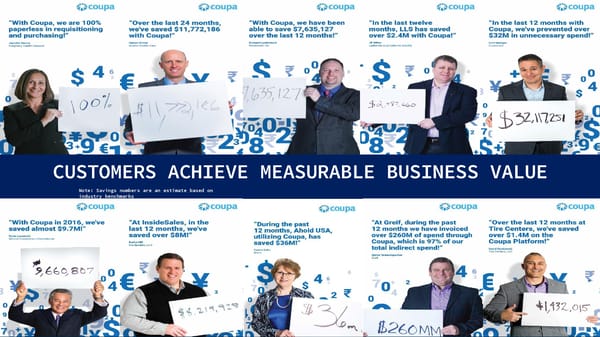
CUSTOMERS ACHIEVE MEASURABLE BUSINESS VALUE Note: Savings numbers are an estimate based on industry benchmarks ©2017 Coupa Software, Inc. – Confidential – All Rights Reserved 10 *Savings is an estimate based on industry bhk
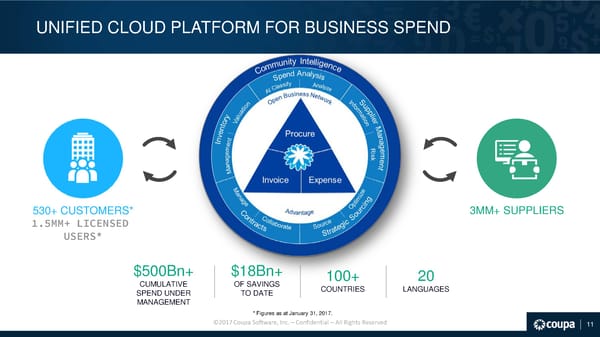
UNIFIED CLOUD PLATFORM FOR BUSINESS SPEND 530+ CUSTOMERS* 3MM+ SUPPLIERS 1.5MM+ LICENSED USERS* $500Bn+ $18Bn+ 100+ 20 CUMULATIVE OF SAVINGS COUNTRIES LANGUAGES SPEND UNDER TO DATE MANAGEMENT * Figures as at January 31, 2017. ©2017 Coupa Software, Inc. – Confidential – All Rights Reserved 11
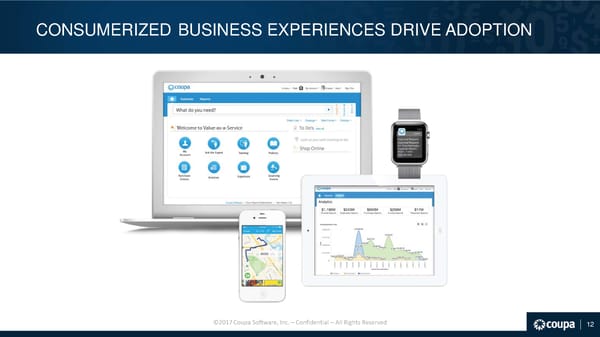
CONSUMERIZED BUSINESS EXPERIENCES DRIVE ADOPTION ©2017 Coupa Software, Inc. – Confidential – All Rights Reserved 12
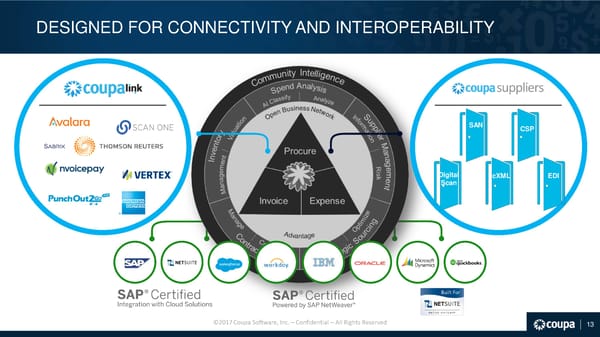
DESIGNED FOR CONNECTIVITY AND INTEROPERABILITY SAN CSP Digital cXML EDI Scan ©2017 Coupa Software, Inc. – Confidential – All Rights Reserved 13
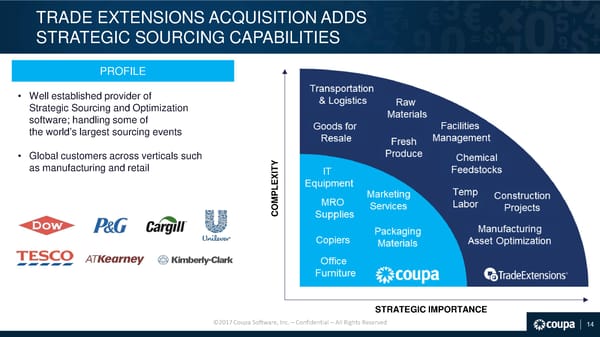
TRADE EXTENSIONS ACQUISITION ADDS STRATEGIC SOURCING CAPABILITIES PROFILE • Well established provider of Transportation Strategic Sourcing and Optimization & Logistics Raw software; handling some of Materials the world’s largest sourcing events Goods for Facilities Resale Fresh Management • Global customers across verticals such Produce Chemical Y as manufacturing and retail T Feedstocks EXI PL Temp Construction M Labor O Projects C Manufacturing Asset Optimization STRATEGIC IMPORTANCE ©2017 Coupa Software, Inc. – Confidential – All Rights Reserved 14
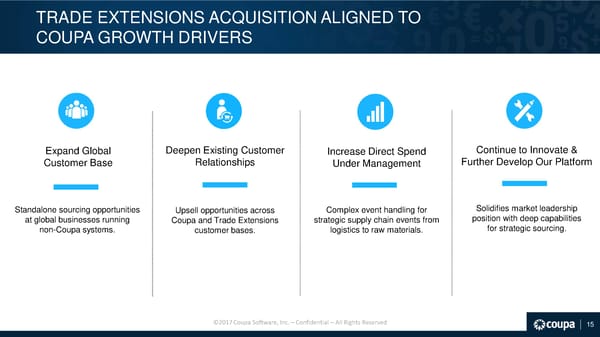
TRADE EXTENSIONS ACQUISITION ALIGNED TO COUPA GROWTH DRIVERS Expand Global Deepen Existing Customer Increase Direct Spend Continue to Innovate & Customer Base Relationships Under Management Further Develop Our Platform Standalone sourcing opportunities Upsell opportunities across Complex event handling for Solidifies market leadership at global businesses running Coupa and Trade Extensions strategic supply chain events from position with deep capabilities non-Coupa systems. customer bases. logistics to raw materials. for strategic sourcing. ©2017 Coupa Software, Inc. – Confidential – All Rights Reserved 15
CONTINUED PROGRESS AGAINST KEY METRICS AND RECENT WINS Q2 2017 Q2 2018 Q2 2017 Q2 2018 Cumulative >$255Bn >$500Bn LTM Revenue $109MM $159MM Spend Under Management Savings to Date >$8Bn >$18Bn Non-GAAP Gross Margin 65% 71% Recent Customer and Partnership Wins Note: We calculate the lifetime value of our customers and associated customer acquisition costs for a particular year by comparing (1) gross profit from net new subscription revenues for the year multiplied by the inverse of the estimated subscription renewal rate to (2) total sales and marketing expense incurred in the preceding year ©2017 Coupa Software, Inc. – Confidential – All Rights Reserved 16
LARGE MARKET OPPORTUNITY 2017 ANALYST ESTIMATED MARKET $9.6Bn $16.8Bn $2.7Bn $4.5Bn (1) PROCUREMENT EXPENSE SUPPLY CHAIN TOTAL MANAGEMENT (2) MANAGEMENT (1) (1) International Data Corporation, Worldwide Semiannual Software Tracker, November 2016 (2) Technavio market research sourced from ISI Securities EMIS, Global SaaS-based Expense Management Market, December 2013 ©2017 Coupa Software, Inc. – Confidential – All Rights Reserved 17
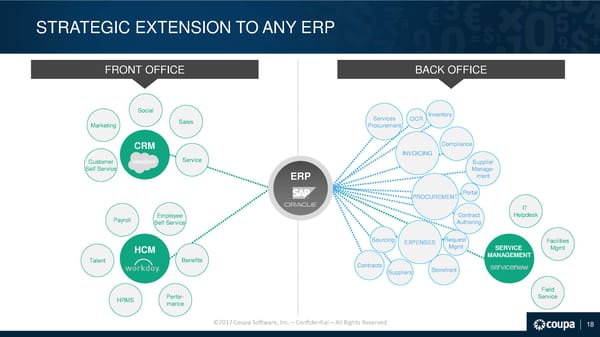
STRATEGIC EXTENSION TO ANY ERP FRONT OFFICE BACK OFFICE Social Inventory Sales Services OCR Marketing Procurement CRM Compliance INVOICING Customer Service Supplier Self Service Manage- ERP ment PROCUREMENT Portal IT Payroll Employee Contract Helpdesk Self Service Authoring Sourcing EXPENSES Request Facilities HCM Mgmt SERVICE Mgmt Talent Benefits MANAGEMENT Contracts Storefront Suppliers Field HRMS Perfor- Service mance ©2017 Coupa Software, Inc. – Confidential – All Rights Reserved 18
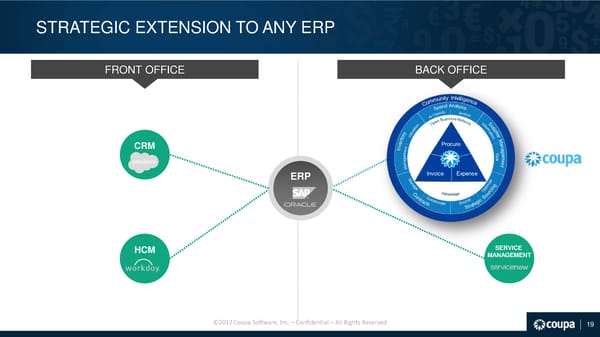
STRATEGIC EXTENSION TO ANY ERP FRONT OFFICE BACK OFFICE CRM PROCURE ERP INVOICE HCM SERVICE MANAGEMENT ©2017 Coupa Software, Inc. – Confidential – All Rights Reserved 19
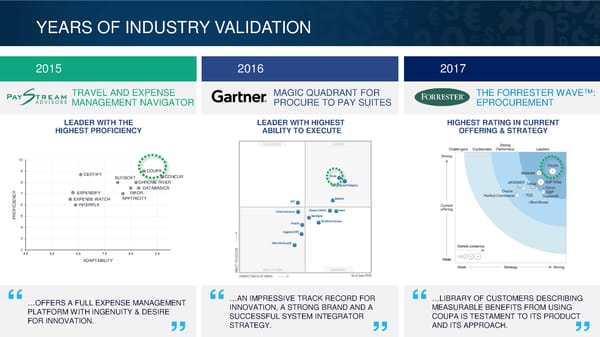
YEARS OF INDUSTRY VALIDATION 2015 2016 2017 TRAVEL AND EXPENSE MAGIC QUADRANT FOR THE FORRESTER WAVE™: MANAGEMENT NAVIGATOR PROCURE TO PAY SUITES EPROCUREMENT LEADER WITH THE LEADER WITH HIGHEST HIGHEST RATING IN CURRENT HIGHEST PROFICIENCY ABILITY TO EXECUTE OFFERING & STRATEGY 10 9 CERTIFY COUPA SUTISOFT CONCUR 8 CHROME RIVER DATABASICS 7 EXPENSIFY INFOR NCY EXPENSE WATCH APPTRICITY E CI6 INTERPLX I F RO5 P 4 3 2 4.5 5.5 6.5 7.5 8.5 9.5 ADAPTABILITY …AN IMPRESSIVE TRACK RECORD FOR …LIBRARY OF CUSTOMERS DESCRIBING “ “ “ …OFFERS A FULL EXPENSE MANAGEMENT INNOVATION, A STRONG BRAND AND A MEASURABLE BENEFITS FROM USING PLATFORM WITH INGENUITY & DESIRE “ “ “ 20 FOR INNOVATION. SUCCESSFUL SYSTEM INTEGRATOR COUPA IS TESTAMENT TO ITS PRODUCT ©2017 Coupa Software, Inc. – Confidential – All Rights Reserved 20 STRATEGY. AND ITS APPROACH.
BEST OF BOTH WORLDS PARTNERSHIP Enterprise Open Control + Marketplace ©2017 Coupa Software, Inc. – Confidential – All Rights Reserved 21
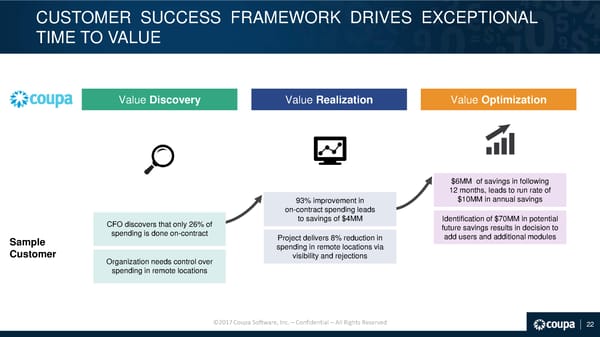
CUSTOMER SUCCESS FRAMEWORK DRIVES EXCEPTIONAL TIME TO VALUE Value Discovery Value Realization Value Optimization $6MM of savings in following 12 months, leads to run rate of 93% improvement in $10MM in annual savings on-contract spending leads CFO discovers that only 26% of to savings of $4MM Identification of $70MM in potential spending is done on-contract future savings results in decision to Sample Project delivers 8% reduction in add users and additional modules Customer spending in remote locations via Organization needs control over visibility and rejections spending in remote locations ©2017 Coupa Software, Inc. – Confidential – All Rights Reserved 22
TYPES OF PRESCRIPTIVE INTELLIGENCE Application Intelligence Suite Synergy Intelligence Community Intelligence ©2017 Coupa Software, Inc. – Confidential – All Rights Reserved 23
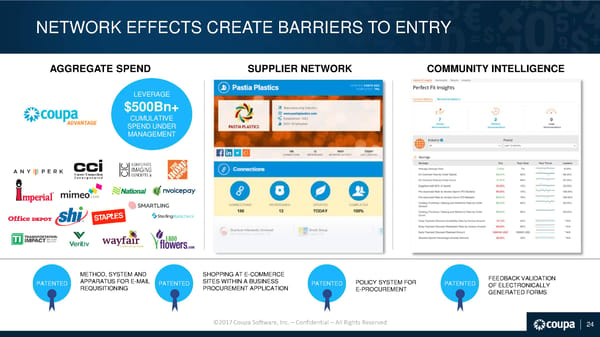
NETWORK EFFECTS CREATE BARRIERS TO ENTRY AGGREGATE SPEND SUPPLIER NETWORK COMMUNITY INTELLIGENCE LEVERAGE $500Bn+ CUMULATIVE SPEND UNDER MANAGEMENT METHOD, SYSTEM AND SHOPPING AT E-COMMERCE FEEDBACK VALIDATION PATENTED APPARATUS FOR E-MAIL PATENTED SITES WITHIN A BUSINESS PATENTED POLICY SYSTEM FOR PATENTED OF ELECTRONICALLY REQUISITIONING PROCUREMENT APPLICATION E-PROCUREMENT GENERATED FORMS ©2017 Coupa Software, Inc. – Confidential – All Rights Reserved 24
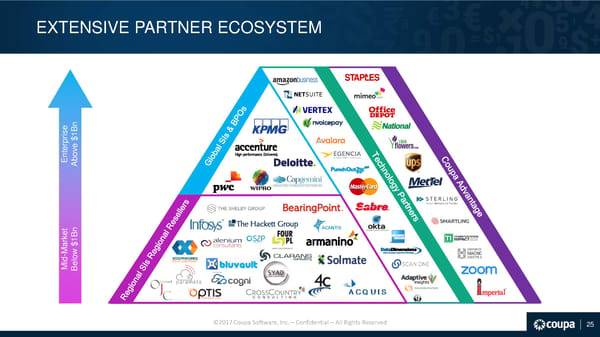
EXTENSIVE PARTNER ECOSYSTEM e n s i pr e $1B er nt bov E A et n k Mar $1B - ow id el M B ©2017 Coupa Software, Inc. – Confidential – All Rights Reserved 25
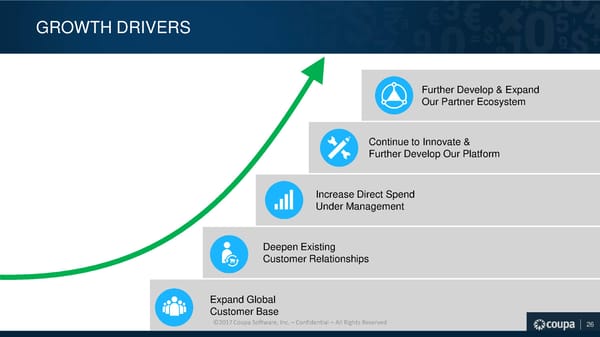
GROWTH DRIVERS Further Develop & Expand Our Partner Ecosystem Continue to Innovate & Further Develop Our Platform Increase Direct Spend Under Management Deepen Existing Customer Relationships Expand Global Customer Base ©2017 Coupa Software, Inc. – Confidential – All Rights Reserved 26
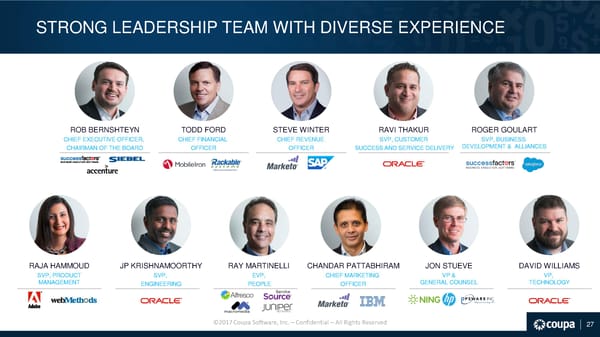
STRONG LEADERSHIP TEAM WITH DIVERSE EXPERIENCE ROB BERNSHTEYN TODD FORD STEVE WINTER RAVI THAKUR ROGER GOULART CHIEF EXECUTIVE OFFICER, CHIEF FINANCIAL CHIEF REVENUE SVP, CUSTOMER SVP, BUSINESS CHAIRMAN OF THE BOARD OFFICER OFFICER SUCCESS AND SERVICE DELIVERY DEVELOPMENT & ALLIANCES RAJA HAMMOUD JP KRISHNAMOORTHY RAY MARTINELLI CHANDAR PATTABHIRAM JON STUEVE DAVID WILLIAMS SVP, PRODUCT SVP, EVP, CHIEF MARKETING VP & VP, MANAGEMENT ENGINEERING PEOPLE OFFICER GENERAL COUNSEL TECHNOLOGY ©2017 Coupa Software, Inc. – Confidential – All Rights Reserved 27
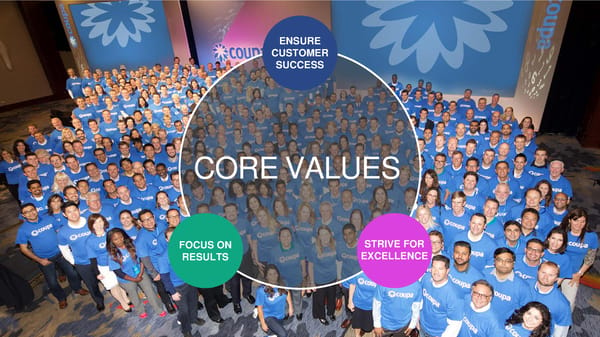
ENSURE CUSTOMER SUCCESS CORE VALUES FOCUS ON STRIVE FOR RESULTS EXCELLENCE ©2017 Coupa Software, Inc. – Confidential – All Rights Reserved 28
TODD FORD CHIEF FINANCIAL OFFICER ©©22001177 C Coouuppaa SSooffttwawarree,, IInncc.. –– CCoonnffiiddeennttiiaall –– AAllll Ri Rigghhttss ReResseervrveded 29 29

FINANCIAL HIGHLIGHTS STRONG REVENUE GROWTH RECURRING SUBSCRIPTION REVENUE MODEL WITH HIGH VISIBILITY CONSISTENT COHORT SPENDING WITH HIGH PROFITABILITY COMPELLING UNIT ECONOMICS DEMONSTRATE POWERFUL BUSINESS MODEL ©2017 Coupa Software, Inc. – Confidential – All Rights Reserved 30
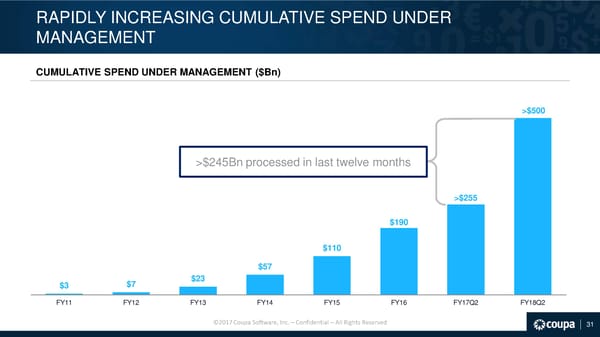
RAPIDLY INCREASING CUMULATIVE SPEND UNDER MANAGEMENT CUMULATIVE SPEND UNDER MANAGEMENT ($Bn) >$500 >$245Bn processed in last twelve months >$255 $190 $110 $57 $3 $7 $23 FY11 FY12 FY13 FY14 FY15 FY16 FY17Q2 FY18Q2 ©2017 Coupa Software, Inc. – Confidential – All Rights Reserved 31
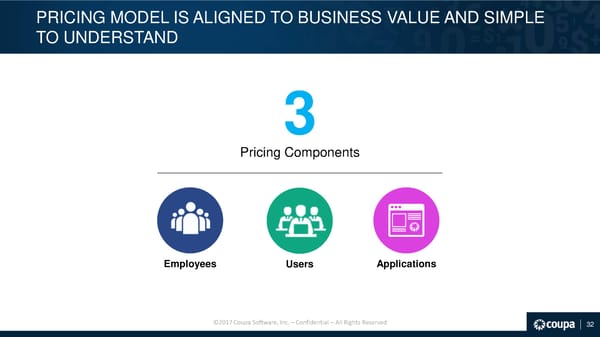
PRICING MODEL IS ALIGNED TO BUSINESS VALUE AND SIMPLE TO UNDERSTAND 3 Pricing Components Employees Users Applications ©2017 Coupa Software, Inc. – Confidential – All Rights Reserved 32
RAPID REVENUE GROWTH HISTORICAL ANNUAL REVENUE ($MM) HISTORICAL QUARTERLY SUBSCRIPTION SERVICES REVENUE ($MM) $134 44% YoY 12% Growth $36 $40 $84 $34 88% $31 10% $25 $28 $23 $51 90% $21 15% 62% CAGR 85% FY15 FY16 FY17 FQ3'16 FQ4'16 FQ1'17 FQ2'17 FQ3'17 FQ4'17 FQ1'18 FQ2'18 Subscription Services Professional Services ©2017 Coupa Software, Inc. – Confidential – All Rights Reserved 33
COHORT DATA DEMONSTRATES POWERFUL BUSINESS MODEL CUSTOMER COHORT CONTRIBUTION MARGINS ($MM) 75% 75% 74% 75% $9.9 $10.0 $10.1 $11.6 $4.0 ($2.5) ($2.5) ($2.6) ($2.9) ($14.0) (249%) FY13 FY14 FY15 FY16 FY17 Subscription Revenue Variable Costs Contribution Margin ©2017 Coupa Software, Inc. – Confidential – All Rights Reserved 34
COMPELLING UNIT ECONOMICS LTV/ CAC >$6 $1 CUSTOMER ACQUISITION COST LIFETIME VALUE Note 1: LTV/CAC was reported for the period ending FY17; Updates to this metric are expected to be provided on an annual basis Note 2: We calculate the lifetime value of our customers and associated customer acquisition costs for a particular year by comparing (1) gross profit from net new subscription revenues for the year multiplied by the inverse of the estimated subscription renewal rate to (2) total sales and marketing expense incurred in the preceding year ©2017 Coupa Software, Inc. – Confidential – All Rights Reserved 35
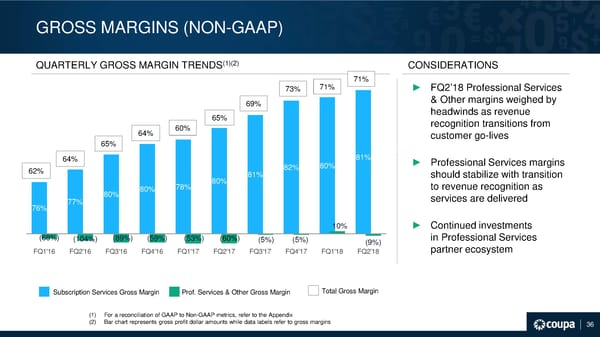
GROSS MARGINS (NON-GAAP) QUARTERLY GROSS MARGIN TRENDS(1)(2) CONSIDERATIONS 71% 73% 71% ► FQ2’18 Professional Services 69% & Other margins weighed by 65% headwinds as revenue 60% recognition transitions from 64% customer go-lives 65% 64% 81% ► Professional Services margins 62% 82% 80% 80% 81% should stabilize with transition 80% 80% 78% to revenue recognition as 77% services are delivered 76% 10% ► Continued investments (68%) (104%) (89%) (59%) (53%) (60%) (5%) (5%) (9%) in Professional Services FQ1'16 FQ2'16 FQ3'16 FQ4'16 FQ1'17 FQ2'17 FQ3'17 FQ4'17 FQ1'18 FQ2'18 partner ecosystem Subscription Services Gross Margin Prof. Services & Other Gross Margin Total Gross Margin (1) For a reconciliation of GAAP to Non-GAAP metrics, refer to the Appendix (2) Bar chart represents gross profit dollar amounts while data labels refer to gross margins ©2017 Coupa Software, Inc. – Confidential – All Rights Reserved 36
BUSINESS MODEL TO PROVIDE OPERATING LEVERAGE (1)) (NON-GAAP FY17 FQ2’18 MID-TERM* LONG-TERM* Gross Margin 67% 71% 68-70% 75-80% R&D as % of 21% 20% 18-21% 12-15% Revenue S&M as % of 49% 48% 47-50% 35-40% Revenue G&A as % of 16% 16% 11-13% 7-10% Revenue Operating Margin (19%) (13%) (10-20%) 20%+ FCF Margin(2) (19%) 18%; (1%) TTM 0-5% 20%+ (1) For a reconciliation of GAAP to Non-GAAP metrics, refer to the Appendix (2) FCF stands for free cash flow, which is generally calculated as cash flow from operating activities plus cash flow from investing activities. The Company excludes the impact of acquisitions when reporting FCF. *These measures are forward-looking; are subject to significant business, economic, regulatory and competitive uncertainties and contingencies, many of which are beyond the control of the Company and its management; and are based upon assumptions with respect to future decisions, which are subject to change. Actual results will vary and those variations may be material. For discussion of some of the important factors that could cause these variations, please consult the “Risk Factors” section in our most recently filed Form 10-K or 10-Q. Nothing in this presentation ©2017 Coupa Software, Inc. – Confidential – All Rights Reserved should be regarded as a representation by any person that these measures will be achieved and the Company undertakes no duty to update these measures. 37
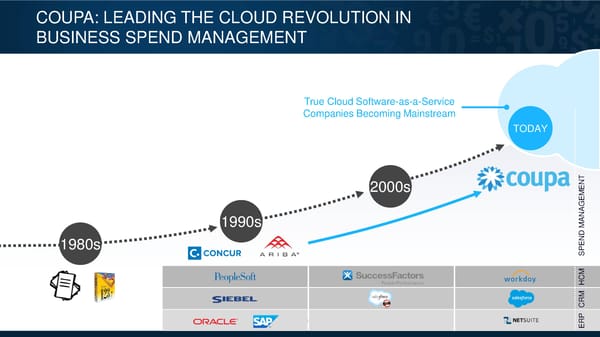
COUPA: LEADING THE CLOUD REVOLUTION IN BUSINESS SPEND MANAGEMENT True Cloud Software-as-a-Service Companies Becoming Mainstream TODAY T 2000s EN EM AG 1990s AN M 1980s D SPEN HCM CRM 38 ©2017 Coupa Software, Inc. – Confidential – All Rights Reserved RP38 E
CLOUD PLATFORM FOR BUSINESS SPEND ©2017 Coupa Software, Inc. – Confidential – All Rights Reserved 39

APPENDIX ©©22001177 C Coouuppaa SSooffttwawarree,, IInncc.. –– CCoonnffiiddeennttiiaall –– AAllll Ri Rigghhttss ReResseervrveded 40 40
GAAP TO NON-GAAP RECONCILIATION Q1 FY'17 Q2 FY'17 Q3 FY'17 Q4 FY'17 Q1 FY'18 Q2 FY'18 FY 2017 Subscription Revenue $25,372 $27,783 $30,799 $33,834 $35,664 $39,764 $117,788 Professional Services Revenue $3,811 $3,349 $4,643 $4,184 $5,473 $4,787 $15,987 Total Revenue $29,183 $31,132 $35,442 $38,018 $41,137 $44,551 $133,775 GAAP Subscription COGS $6,050 $6,029 $6,346 $6,630 $7,996 $9,025 $25,055 Amortization of acquired intangible assets $221 $212 $212 $308 $486 $788 $953 Share-based compensation expense $125 $140 $150 $300 $355 $529 $715 Non-GAAP Subscription COGS $5,704 $5,677 $5,984 $6,022 $7,155 $7,708 $23,387 GAAP Subscription Gross Profit $19,322 $21,754 $24,453 $27,204 $27,668 $30,739 $92,733 % Margin 76% 78% 79% 80% 78% 77% 79% Non-GAAP Subscription Gross Profit $19,668 $22,106 $24,815 $27,812 $28,509 $32,056 $94,401 % Margin 78% 80% 81% 82% 80% 81% 80% GAAP Professional Services COGS $5,968 $5,452 $5,031 $4,763 $5,501 $5,923 $21,214 Share-based compensation expense $135 $109 $155 $373 $563 $716 $772 Non-GAAP Professional Services COGS $5,833 $5,343 $4,876 $4,390 $4,938 $5,207 $20,442 GAAP Professional Services Gross Profit ($2,157) ($2,103) ($388) ($579) ($28) ($1,136) ($5,227) % Margin (57%) (63%) (8%) (14%) (1%) (24%) (33%) Non-GAAP Professional Services Gross Profit ($2,022) ($1,994) ($233) ($206) $536 ($420) ($4,455) % Margin (53%) (60%) (5%) (5%) 10% (9%) (28%) GAAP Total Gross Profit $17,165 $19,651 $24,065 $26,625 $27,640 $29,603 $87,506 % Margin 59% 63% 68% 70% 67% 66% 65% Non-GAAP Total Gross Profit $17,646 $20,112 $24,582 $27,606 $29,044 $31,636 $89,946 % Margin 60% 65% 69% 73% 71% 71% 67% ©2017 Coupa Software, Inc. – Confidential – All Rights Reserved 41
GAAP TO NON-GAAP RECONCILIATION (CONT’D) Q1 FY'17 Q2 FY'17 Q3 FY'17 Q4 FY'17 Q1 FY'18 Q2 FY'18 FY 2017 GAAP Research & Development $7,840 $7,206 $7,179 $8,037 $9,171 $10,720 $30,262 Amortization of acquired intangible assets $0 $0 $0 $0 $0 $0 $0 Share-based compensation expense $322 $303 $357 $784 $1,152 $1,647 $1,766 Non-GAAP R&D expenses $7,518 $6,903 $6,822 $7,253 $8,019 $9,073 $28,496 % of Revenue 26% 22% 19% 19% 19% 20% 21% GAAP Sales & Marketing $15,836 $19,252 $16,315 $17,159 $20,679 $23,812 $68,562 Amortization of acquired intangible assets $0 $0 $0 $0 $0 $189 $0 Share-based compensation expense $471 $441 $937 $1,282 $1,600 $2,340 $3,131 Non-GAAP S&M expenses $15,365 $18,811 $15,378 $15,877 $19,079 $21,283 $65,431 % of Revenue 53% 60% 43% 42% 46% 48% 49% GAAP General & Administrative $5,553 $4,620 $6,068 $7,865 $8,177 $9,430 $24,106 Litigation-related costs $123 $26 $1 $0 $0 $0 $150 Share-based compensation expense $653 $566 $785 $1,064 $1,607 $2,406 $3,068 Non-GAAP G&A expenses $4,777 $4,028 $5,282 $6,801 $6,570 $7,024 $20,888 % of Revenue 16% 13% 15% 18% 16% 16% 16% GAAP Operating Profit ($12,064) ($11,427) ($5,497) ($6,436) ($10,387) ($14,359) ($35,424) % Margin (41%) (37%) (16%) (17%) (25%) (32%) (26%) Non-GAAP Operating Profit ($10,014) ($9,630) ($2,900) ($2,325) ($4,624) ($5,743) ($24,869) % Margin (34%) (31%) (8%) (6%) (11%) (13%) (19%) Operating Cash Flows (10,226) 2, 507 ( 2,825) (10,411) 7, 160 9, 178 (20,955) Investing Cash Flows ( 1,386) ( 1,070) ( 1,044) ( 7,741) ( 1,353) (40,038) (11,241) Less: Acquisitions - - - ( 6,750) (140) (38,933) ( 6,750) Free Cash Flow (FCF)* (11,612) 1, 437 ( 3,869) (11,402) 5, 947 8, 073 (25,446) % Margin (40%) 5% (11%) (30%) 14% 18% (19%) * Free cash flow is generally calculated as cash flow from operating activities plus cash flow from investing activities. As illustrated above, the Company excludes the impact of acquisitions when reporting free cash flow. ©2017 Coupa Software, Inc. – Confidential – All Rights Reserved 42
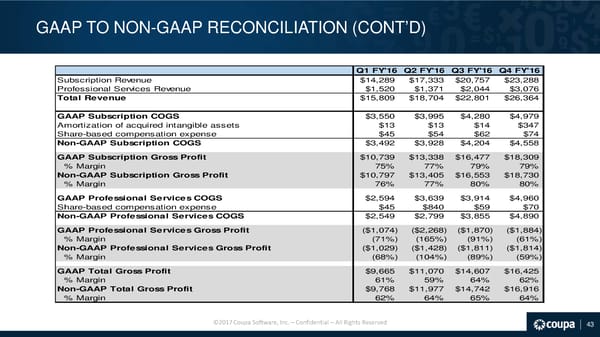
GAAP TO NON-GAAP RECONCILIATION (CONT’D) Q1 FY'16 Q2 FY'16 Q3 FY'16 Q4 FY'16 Subscription Revenue $14,289 $17,333 $20,757 $23,288 Professional Services Revenue $1,520 $1,371 $2,044 $3,076 Total Revenue $15,809 $18,704 $22,801 $26,364 GAAP Subscription COGS $3,550 $3,995 $4,280 $4,979 Amortization of acquired intangible assets $13 $13 $14 $347 Share-based compensation expense $45 $54 $62 $74 Non-GAAP Subscription COGS $3,492 $3,928 $4,204 $4,558 GAAP Subscription Gross Profit $10,739 $13,338 $16,477 $18,309 % Margin 75% 77% 79% 79% Non-GAAP Subscription Gross Profit $10,797 $13,405 $16,553 $18,730 % Margin 76% 77% 80% 80% GAAP Professional Services COGS $2,594 $3,639 $3,914 $4,960 Share-based compensation expense $45 $840 $59 $70 Non-GAAP Professional Services COGS $2,549 $2,799 $3,855 $4,890 GAAP Professional Services Gross Profit ($1,074) ($2,268) ($1,870) ($1,884) % Margin (71%) (165%) (91%) (61%) Non-GAAP Professional Services Gross Profit ($1,029) ($1,428) ($1,811) ($1,814) % Margin (68%) (104%) (89%) (59%) GAAP Total Gross Profit $9,665 $11,070 $14,607 $16,425 % Margin 61% 59% 64% 62% Non-GAAP Total Gross Profit $9,768 $11,977 $14,742 $16,916 % Margin 62% 64% 65% 64% ©2017 Coupa Software, Inc. – Confidential – All Rights Reserved 43
GAAP TO NON-GAAP RECONCILIATION (CONT’D) Q1 FY'16 Q2 FY'16 Q3 FY'16 Q4 FY'16 GAAP Research & Development $4,431 $5,792 $5,965 $6,579 Amortization of acquired intangible assets $0 $53 $105 ($158) Share-based compensation expense $107 $750 $152 $227 Non-GAAP R&D expenses $4,324 $4,989 $5,708 $6,510 % of Revenue 27% 27% 25% 25% GAAP Sales & Marketing $10,679 $13,532 $14,306 $16,196 Share-based compensation expense $176 $210 $706 $255 Non-GAAP S&M expenses $10,503 $13,322 $13,600 $15,941 % of Revenue 66% 71% 60% 60% GAAP General & Administrative $2,480 $8,719 $3,709 $4,632 Litigation-related costs $642 $848 $327 $126 Share-based compensation expense $186 $5,620 $547 $383 Non-GAAP G&A expenses $1,652 $2,251 $2,835 $4,123 % of Revenue 10% 12% 12% 16% GAAP Operating Profit ($7,925) ($16,973) ($9,373) ($10,982) % Margin (50%) (91%) (41%) (42%) Non-GAAP Operating Profit ($6,711) ($8,585) ($7,401) ($9,658) % Margin (42%) (46%) (32%) (37%) ©2017 Coupa Software, Inc. – Confidential – All Rights Reserved 44