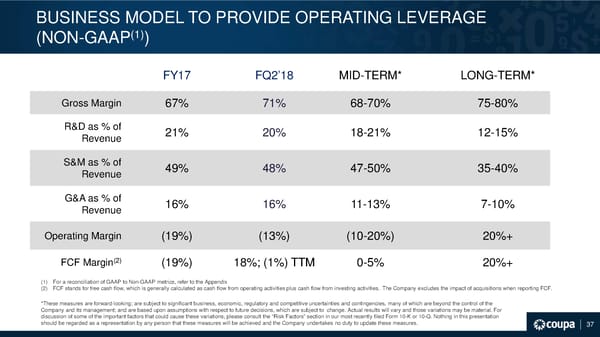
BUSINESS MODEL TO PROVIDE OPERATING LEVERAGE (1)) (NON-GAAP FY17 FQ2’18 MID-TERM* LONG-TERM* Gross Margin 67% 71% 68-70% 75-80% R&D as % of 21% 20% 18-21% 12-15% Revenue S&M as % of 49% 48% 47-50% 35-40% Revenue G&A as % of 16% 16% 11-13% 7-10% Revenue Operating Margin (19%) (13%) (10-20%) 20%+ FCF Margin(2) (19%) 18%; (1%) TTM 0-5% 20%+ (1) For a reconciliation of GAAP to Non-GAAP metrics, refer to the Appendix (2) FCF stands for free cash flow, which is generally calculated as cash flow from operating activities plus cash flow from investing activities. The Company excludes the impact of acquisitions when reporting FCF. *These measures are forward-looking; are subject to significant business, economic, regulatory and competitive uncertainties and contingencies, many of which are beyond the control of the Company and its management; and are based upon assumptions with respect to future decisions, which are subject to change. Actual results will vary and those variations may be material. For discussion of some of the important factors that could cause these variations, please consult the “Risk Factors” section in our most recently filed Form 10-K or 10-Q. Nothing in this presentation ©2017 Coupa Software, Inc. – Confidential – All Rights Reserved should be regarded as a representation by any person that these measures will be achieved and the Company undertakes no duty to update these measures. 37
 Coupa Investor Presentation Page 37 Page 39