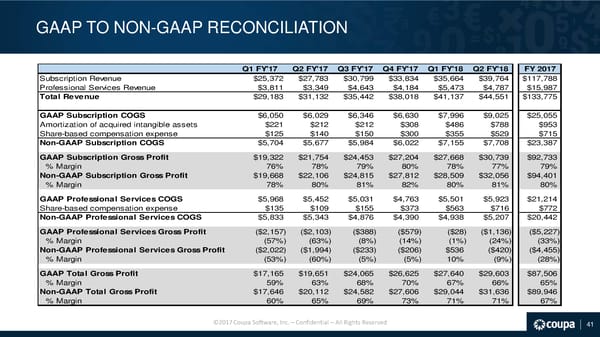
GAAP TO NON-GAAP RECONCILIATION Q1 FY'17 Q2 FY'17 Q3 FY'17 Q4 FY'17 Q1 FY'18 Q2 FY'18 FY 2017 Subscription Revenue $25,372 $27,783 $30,799 $33,834 $35,664 $39,764 $117,788 Professional Services Revenue $3,811 $3,349 $4,643 $4,184 $5,473 $4,787 $15,987 Total Revenue $29,183 $31,132 $35,442 $38,018 $41,137 $44,551 $133,775 GAAP Subscription COGS $6,050 $6,029 $6,346 $6,630 $7,996 $9,025 $25,055 Amortization of acquired intangible assets $221 $212 $212 $308 $486 $788 $953 Share-based compensation expense $125 $140 $150 $300 $355 $529 $715 Non-GAAP Subscription COGS $5,704 $5,677 $5,984 $6,022 $7,155 $7,708 $23,387 GAAP Subscription Gross Profit $19,322 $21,754 $24,453 $27,204 $27,668 $30,739 $92,733 % Margin 76% 78% 79% 80% 78% 77% 79% Non-GAAP Subscription Gross Profit $19,668 $22,106 $24,815 $27,812 $28,509 $32,056 $94,401 % Margin 78% 80% 81% 82% 80% 81% 80% GAAP Professional Services COGS $5,968 $5,452 $5,031 $4,763 $5,501 $5,923 $21,214 Share-based compensation expense $135 $109 $155 $373 $563 $716 $772 Non-GAAP Professional Services COGS $5,833 $5,343 $4,876 $4,390 $4,938 $5,207 $20,442 GAAP Professional Services Gross Profit ($2,157) ($2,103) ($388) ($579) ($28) ($1,136) ($5,227) % Margin (57%) (63%) (8%) (14%) (1%) (24%) (33%) Non-GAAP Professional Services Gross Profit ($2,022) ($1,994) ($233) ($206) $536 ($420) ($4,455) % Margin (53%) (60%) (5%) (5%) 10% (9%) (28%) GAAP Total Gross Profit $17,165 $19,651 $24,065 $26,625 $27,640 $29,603 $87,506 % Margin 59% 63% 68% 70% 67% 66% 65% Non-GAAP Total Gross Profit $17,646 $20,112 $24,582 $27,606 $29,044 $31,636 $89,946 % Margin 60% 65% 69% 73% 71% 71% 67% ©2017 Coupa Software, Inc. – Confidential – All Rights Reserved 41
 Coupa Investor Presentation Page 41 Page 43