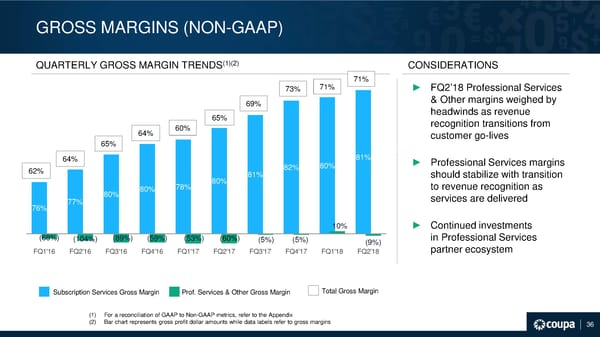
GROSS MARGINS (NON-GAAP) QUARTERLY GROSS MARGIN TRENDS(1)(2) CONSIDERATIONS 71% 73% 71% ► FQ2’18 Professional Services 69% & Other margins weighed by 65% headwinds as revenue 60% recognition transitions from 64% customer go-lives 65% 64% 81% ► Professional Services margins 62% 82% 80% 80% 81% should stabilize with transition 80% 80% 78% to revenue recognition as 77% services are delivered 76% 10% ► Continued investments (68%) (104%) (89%) (59%) (53%) (60%) (5%) (5%) (9%) in Professional Services FQ1'16 FQ2'16 FQ3'16 FQ4'16 FQ1'17 FQ2'17 FQ3'17 FQ4'17 FQ1'18 FQ2'18 partner ecosystem Subscription Services Gross Margin Prof. Services & Other Gross Margin Total Gross Margin (1) For a reconciliation of GAAP to Non-GAAP metrics, refer to the Appendix (2) Bar chart represents gross profit dollar amounts while data labels refer to gross margins ©2017 Coupa Software, Inc. – Confidential – All Rights Reserved 36
 Coupa Investor Presentation Page 36 Page 38